Building Amenity Metapaths on Streets from OpenStreetMap#
This notebook introduces the way of adding metapaths on heterogeous graph using functions from city2graph.
What is a Metapath?#
A metapath is a composite relation that defines a path through a heterogeneous graph, connecting nodes across multiple edge types.
For example, consider a heterogeneous graph with three node types:
Amenity nodes (e.g., cafes, restaurants)
Segment nodes (representing street segments in a dual graph)
And edge types:
("amenity", "is_nearby", "segment"): connects an amenity to its nearest street segment("segment", "connects", "segment"): connects adjacent street segments
A metapath like Amenity → Segment → Segment → Amenity represents a walk where:
Start at an Amenity
Move to a connected Segment (via “is_nearby”)
Move to another connected Segment (via “connects”)
Arrive at another Amenity (via “is_nearby”, reversed)
This captures the idea of “amenities accessible via walking two street segments apart.”
This walkthrough pulls the real street network around Soho (central London) from OpenStreetMap with osmnx. We convert the primary street graph to its dual representation where street primary edges become street dual nodes and connections between adjacent street primary edges become street dual edges. We build a heterogeneous graph where amenities are attached to their closest street dual nodes. Finally, add_metapaths materialises Amenity → street dual node → street dual node → Amenity
walks so we can analyse higher-order access between attractions.
[1]:
import geopandas as gpd
import osmnx as ox
import pandas as pd

import matplotlib.pyplot as plt
from matplotlib.lines import Line2D
from matplotlib.animation import FuncAnimation

import city2graph as c2g
city2graph provides direct support for objects obtained from osmnx. We first construct the dual graph from the primary street network of Soho.
[2]:
# Download and project the street network to British National Grid (EPSG:27700) for metric distances
# Data should be obtained from Only in Soho, London
G_drive = ox.graph_from_place(
    "Soho, London",
    network_type="all",
)
G_proj = ox.project_graph(G_drive, to_crs="EPSG:27700")

# Convert to dual graph
street_primary_nodes, street_primary_edges = c2g.nx_to_gdf(G_proj)
projected_crs = street_primary_edges.crs
We also fetch the amenity POIs in the same extent.
[3]:
amenity_tags = ["cafe", "restaurant", "pub", "bar", "museum", "theatre", "cinema"]
amenity_candidates = ox.features_from_place(
    "Soho, London",
    tags={"amenity": amenity_tags},
).to_crs(projected_crs)

print(f"Street primary edges: {len(street_primary_edges):,}")
print(f"Street primary nodes: {len(street_primary_nodes):,}")
print(f"Candidate Amenities: {len(amenity_candidates):,}")
Street primary edges: 2,163
Street primary nodes: 784
Candidate Amenities: 432
With the obtained street primary edges and street primary nodes, we construct a dual graph using dual_graph. In this dual representation, street primary edges become street dual nodes, and adjacencies between street primary edges become street dual edges, effectively flipping the primary graph to facilitate higher-order network analysis. This transformation allows us to model connectivity at the segment level, where each street dual node represents a street segment and street dual edges
represent possible transitions between them.
[4]:
# Convert to dual graph
street_dual_nodes, street_dual_edges = c2g.dual_graph((street_primary_nodes, street_primary_edges))

# Drop the multi-index
street_dual_nodes = street_dual_nodes.droplevel(2)
Next we clean the raw GeoDataFrames so they are ready for bridge_nodes and add_metapaths.
[5]:
# Name street dual nodes
street_dual_nodes.index.name = "segment_id"

# Add distance to dual edges
street_dual_edges["distance_m"] = street_dual_edges.geometry.length

# Collapse complex Amenity geometries to points within the projected CRS
amenities = (
    amenity_candidates[["name", "amenity", "geometry"]]
    .copy()
    .explode(index_parts=False)
    .dropna(subset=["geometry"])
)
non_point_mask = ~amenities.geometry.geom_type.isin(["Point"])
amenities.loc[non_point_mask, "geometry"] = amenities.loc[non_point_mask, "geometry"].centroid
amenities = amenities.set_geometry("geometry")
amenities["name"] = amenities["name"].fillna(amenities["amenity"].str.title())
amenities = amenities[~amenities.geometry.is_empty]
amenities = amenities.drop_duplicates(subset="geometry").reset_index(drop=True)
[6]:
# Prepare directed street dual edges (u, v) with metric distances
street_dual_edges.index.names = ["source_segment", "target_segment"]
street_dual_edges = gpd.GeoDataFrame(street_dual_edges, geometry="geometry", crs=projected_crs)

print(f"Filtered Amenities: {len(amenities):,}")
print(f"Prepared street dual edges: {len(street_dual_edges):,}")
Filtered Amenities: 432
Prepared street dual edges: 4,157
Bridge every amenity to its nearest street dual node so the heterogeneous graph links amenities back into the street network. For the example of bridge_nodes, please see this notebook.
[7]:
_, bridge_edges = c2g.bridge_nodes(
    {"amenity": amenities, "segment": street_dual_nodes},
    proximity_method="knn",
    k=1,
)
amenity_to_segment = bridge_edges[("amenity", "is_nearby", "segment")].copy()
amenity_to_segment = amenity_to_segment.rename(columns={"weight": "distance_m"})
amenity_to_segment.index.names = ["amenity_id", "segment_id"]

nodes = {"segment": street_dual_nodes, "amenity": amenities}
edges = {
    ("segment", "connects", "segment"): street_dual_edges,
    ("amenity", "is_nearby", "segment"): amenity_to_segment,
}

avg_links = len(amenity_to_segment) / max(len(amenities), 1)
print(
    f"Amenity→segment links: {len(amenity_to_segment):,} (≈{avg_links:.1f} per Amenity)"
)
Amenity→segment links: 432 (≈1.0 per Amenity)
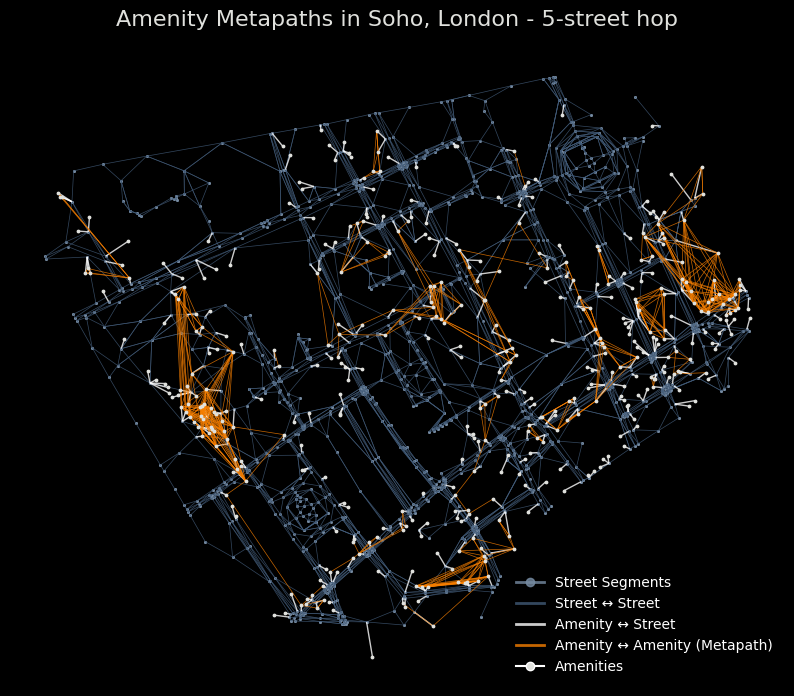
With the heterogeneous graph assembled, we can ask for Amenity → street dual node → street dual node → Amenity metapaths and aggregate their total walking distance. In this example, we have totally 5 hopes of streets between amenities (4 street → street relations in between). By specifying edge_attr and edge_attr_agg, we can also calculate the statistics on edge attributes that are common across edge types (e.g. distance, travel time, etc.).
[8]:
metapaths = [[("amenity", "is_nearby", "segment"),
              ("segment", "connects", "segment"),
              ("segment", "connects", "segment"),
              ("segment", "connects", "segment"),
              ("segment", "connects", "segment"),
              ("segment", "is_nearby", "amenity")]]

nodes_with_mp, edges_with_mp = c2g.add_metapaths(
    (nodes, edges),
    metapaths,
    edge_attr="distance_m",
    edge_attr_agg="sum",
)
As seen below, one edge type has been added:
[9]:
for edge_type in edges_with_mp.keys():
    print(f"{edge_type}: {len(edges_with_mp[edge_type]):,} edges")
('segment', 'connects', 'segment'): 4,157 edges
('amenity', 'is_nearby', 'segment'): 432 edges
('amenity', 'metapath_0', 'amenity'): 776 edges
[10]:
fig, ax = plt.subplots(figsize=(10, 10))

# Set dark background
fig.patch.set_facecolor('black')
ax.set_facecolor('black')

# extract metapath edges
metapath_edges = edges_with_mp[("amenity", "metapath_0", "amenity")]

# Plot all edges: street dual edges, street dual nodes (segments), Amenity to segment links, and metapaths
street_dual_nodes.centroid.plot(ax=ax, color="#778ca3", markersize=1, alpha=0.8, zorder=1)  # Muted blue-gray for street dual nodes (segments)
street_dual_edges.plot(ax=ax, color="#415a77", linewidth=0.5, alpha=0.8, zorder=1)  # Muted blue-gray for street dual edges
amenity_to_segment.plot(ax=ax, color="white", linewidth=1.0, alpha=0.8, zorder=2)  # White for Amenity links (increased linewidth and alpha for visibility)
if not metapath_edges.empty:
    metapath_edges.plot(ax=ax, color="#f77f00", linewidth=0.5, alpha=0.8, zorder=3)  # Warm orange for metapaths (reduced linewidth)

# Treat all amenities as the same nodes: use a single color for all Amenities
amenity_color = "#e0e1dd"  # Light beige for Amenities
ax.scatter(
    amenities.geometry.x,
    amenities.geometry.y,
    s=3,
    color=amenity_color,
    zorder=4,
)

ax.set_title("Amenity Metapaths in Soho, London - 5-street hop", fontsize=16, pad=16, color="#e0e1dd")  # Light title
ax.set_axis_off()

legend_elements = [
    Line2D([0], [0], marker="o", color="#778ca3", lw=2, alpha=0.8, label="Street Segments"),
    Line2D([0], [0], color="#415a77", lw=2, alpha=0.8, label="Street ↔ Street"),
    Line2D([0], [0], color="white", lw=2, alpha=0.8, label="Amenity ↔ Street"),
    Line2D([0], [0], color="#f77f00", lw=2, alpha=0.8, label="Amenity ↔ Amenity (Metapath)"),
    Line2D([0], [0], marker="o", color="w", label="Amenities", markerfacecolor=amenity_color, markersize=6),
]
ax.legend(handles=legend_elements, loc="lower right", frameon=False, fontsize=10, labelcolor='white')

plt.show()

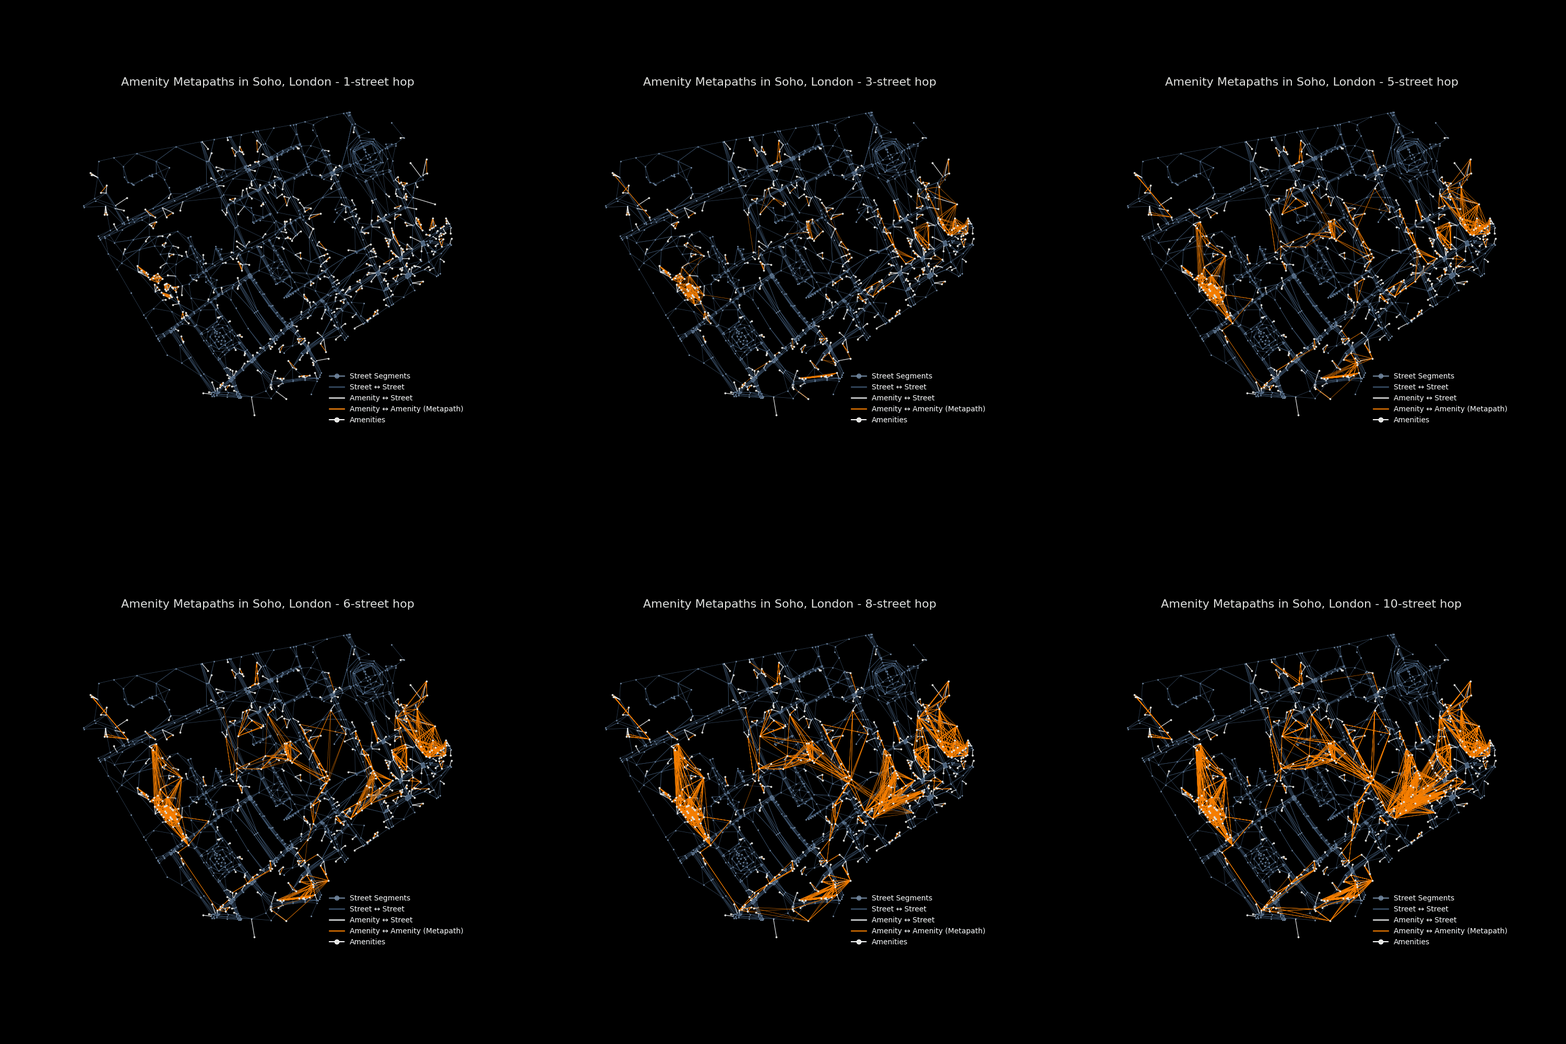
By stacking metapaths while adding the relations, we can see the growth of metapaths:
[11]:
metapaths = []
metapath_edges = []

for i in range(0, 10):
    metapaths = [[("amenity", "is_nearby", "segment")] + [("segment", "connects", "segment")] * i + [("segment", "is_nearby", "amenity")]]

    nodes_with_mp, edges_with_mp = c2g.add_metapaths(
        (nodes, edges),
        metapaths,
        edge_attr="distance_m",
        edge_attr_agg="sum",
    )
    metapath_edges.append(edges_with_mp[(f"amenity", "metapath_0", "amenity")])
[ ]:
fig, ax = plt.subplots(figsize=(10, 10))

# Set dark background
fig.patch.set_facecolor('black')
ax.set_facecolor('black')

# Plot static parts
street_dual_nodes.centroid.plot(ax=ax, color="#778ca3", markersize=1, alpha=0.8, zorder=1)
street_dual_edges.plot(ax=ax, color="#415a77", linewidth=0.5, alpha=0.8, zorder=1)
amenity_to_segment.plot(ax=ax, color="white", linewidth=1.0, alpha=0.8, zorder=2)
ax.scatter(
    amenities.geometry.x,
    amenities.geometry.y,
    s=3,
    color=amenity_color,
    zorder=4,
)

ax.set_title("Amenity Metapaths in Soho, London - 1-street hop", fontsize=16, pad=16, color="#e0e1dd")
ax.set_axis_off()

legend_elements = [
    Line2D([0], [0], marker="o", color="#778ca3", lw=2, alpha=0.8, label="Street Segments"),
    Line2D([0], [0], color="#415a77", lw=2, alpha=0.8, label="Street ↔ Street"),
    Line2D([0], [0], color="white", lw=2, alpha=0.8, label="Amenity ↔ Street"),
    Line2D([0], [0], color="#f77f00", lw=2, alpha=0.8, label="Amenity ↔ Amenity (Metapath)"),
    Line2D([0], [0], marker="o", color="w", label="Amenities", markerfacecolor=amenity_color, markersize=6),
]
ax.legend(handles=legend_elements, loc="lower right", frameon=False, fontsize=10, labelcolor='white')

# Animate the metapaths one by one
def animate(frame):
    hop = frame + 1
    ax.set_title(f"Amenity Metapaths in Soho, London - {hop}-street hop", fontsize=16, pad=16, color="#e0e1dd")
    if not metapath_edges[frame].empty:
        metapath_edges[frame].plot(ax=ax, color="#f77f00", linewidth=0.5, alpha=0.8, zorder=3)

anim = FuncAnimation(fig, animate, frames=len(metapath_edges), interval=1000, repeat=True)
anim.save('../_static/metapath.gif', writer='pillow')


